XRP - HODL UPDATE
Daniel Cheriyan
Daniel Cheriyan
The price of XRP is moving in a minimal range showing an opportunity. Now it is up to us to analyze the charts to understand the probability of that opportunity, and it can be a bullish or a bearish scenario. While exploring the last two cycles of XRP price fluctuations we can see a difference and a similarity while looking at the candles and the relative strength (see figure 1).
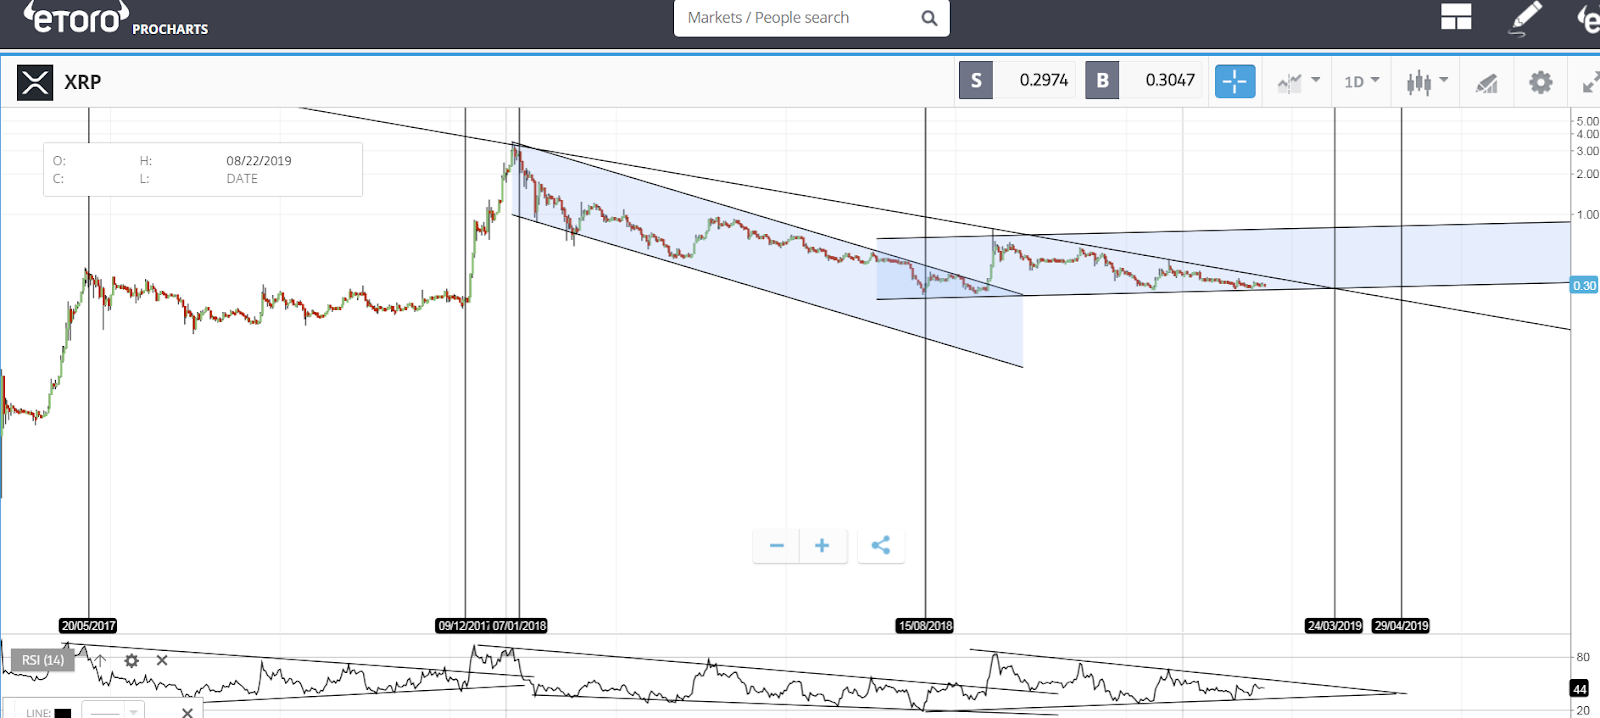
Figure 1
The pattern showcased by the candles and its RSI shows a similarity in the formation of the triangular formation, but the difference is in the current cycle we had two mini trends within the bearish fluctuations from ATH to where we are currently. The RSI shows that the current cycle is an extended one and now we are moving towards a breakout from this trend line (more probability for a bullish breakout). As we are getting more and more news all around us supporting the adoption of XRP, the chances are even high that the next bullish fluctuation may be moving even more than the previous moves. The institutions step into the market by slowly accumulating, and once the positive note gets the attention from the general public the enthusiasm will be back, and we may start enhancing next uptrend (a giant bubble). Thus position your portfolio in such a way that you won't miss the next Bullrun and miss the next revolution which is about to happen in the financial industry.
The following links show the fundamentals of XRP in the long run.
Comments
Post a Comment